
Caso de estudio
LaneTalk
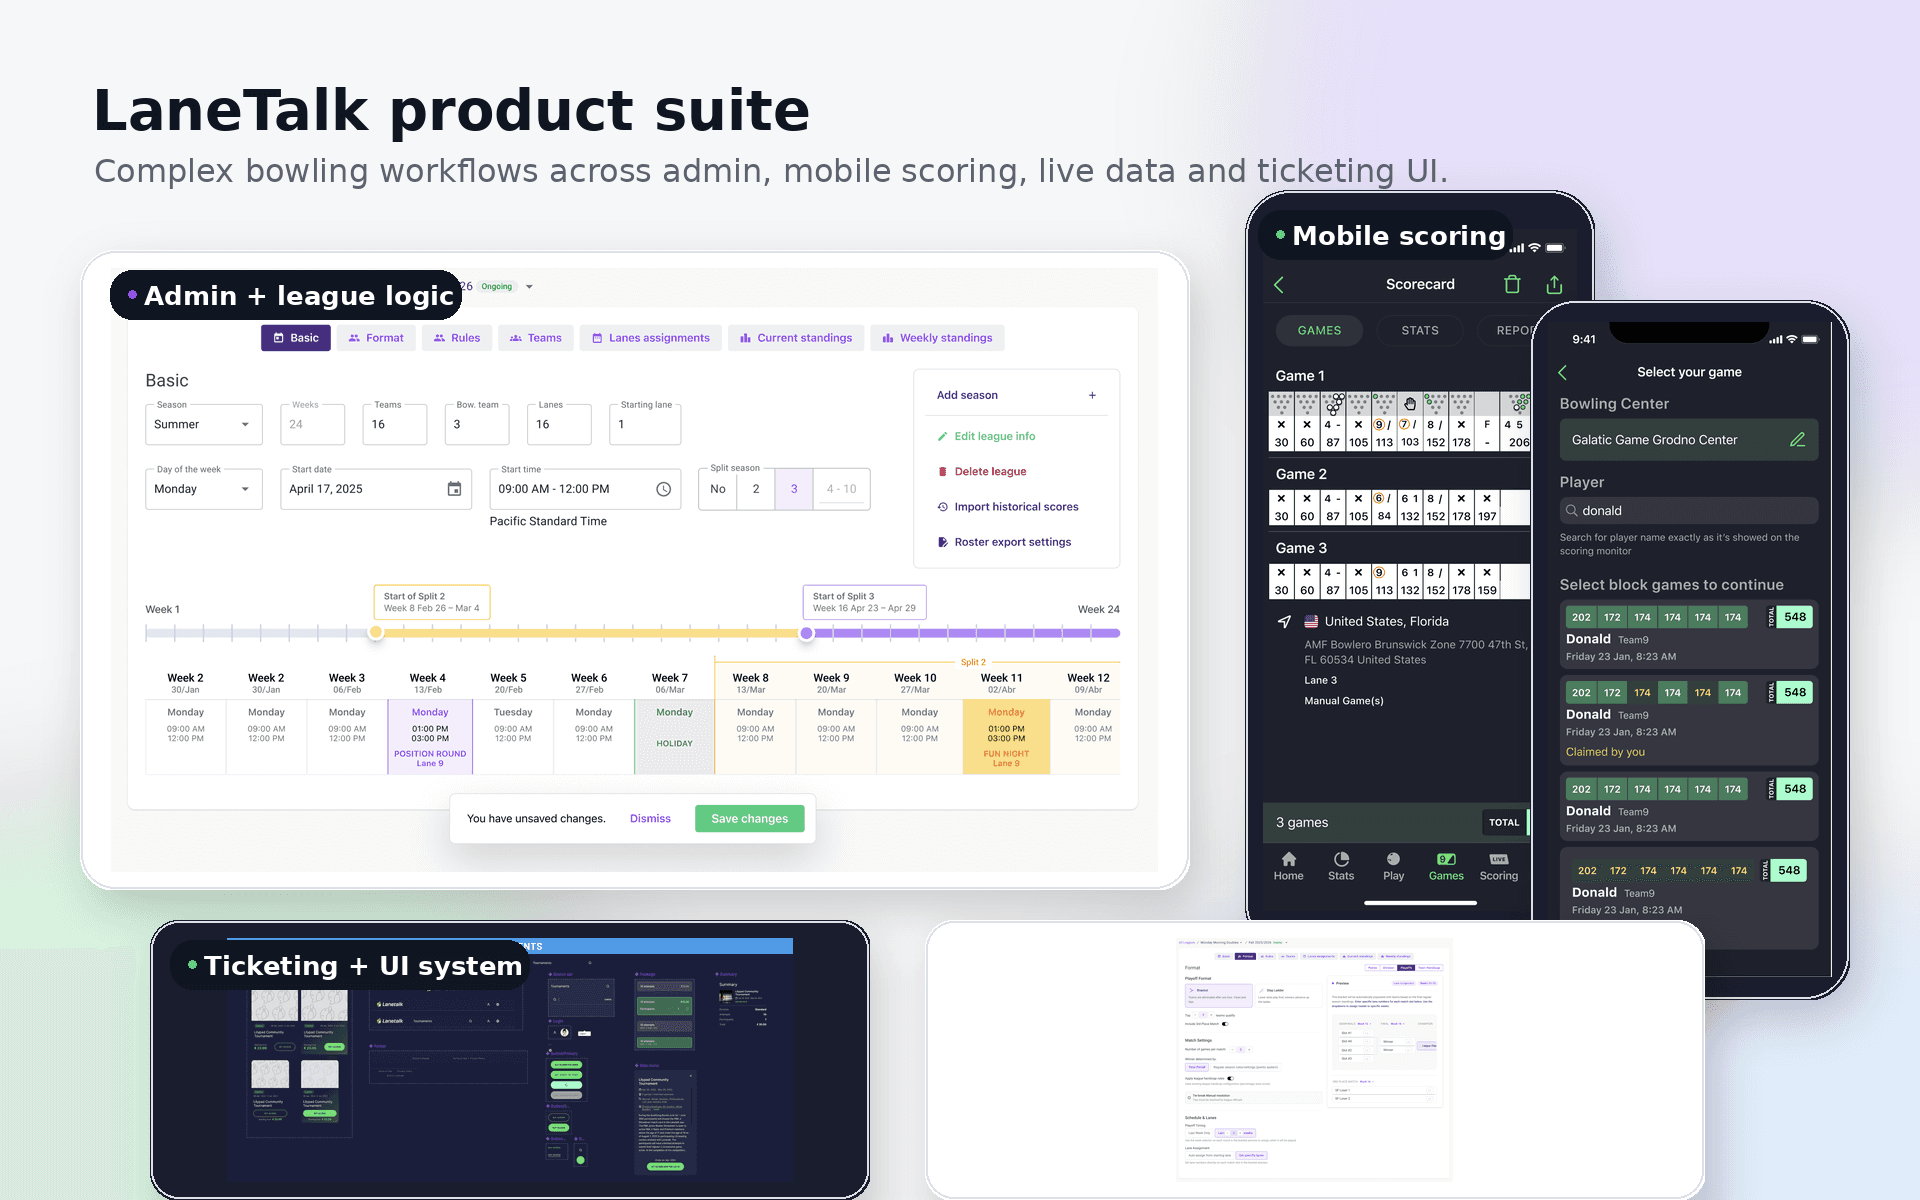
Caso de producto completo para admin de bowling, scoring móvil, datos en vivo, ticketing y sistemas UI.
LaneTalk es un producto de bowling para scoring, ligas, torneos, ticketing y operaciones de centros. Diseñé y construí interfaces frontend para live scoring, herramientas admin, flujos mobile-adjacent y un design system usado en sitios admin, websites y flujos de apps iOS y Android. El trabajo hizo que datos de bowling que cambian rápido fueran más fáciles de leer, operar y extender.
- Role
- Designer & Lead Frontend Developer
- Period
- Recent work, concentrated over the last 3 years
- Ownership
- Diseñé e implementé interfaces de producto en herramientas admin, flujos mobile-adjacent, live scoring, ticketing, sistemas UI, motion, componentes compartidos y entrega frontend de producción.
35%
average load-time reduction
38%
faster product delivery
40%
faster legacy-app load times after Angular-to-React migration
88+
Lighthouse scores achieved consistently
1K+
active users within three months after migration


Problema
Hacer que los datos de bowling sean más usables entre apps, live scoring y herramientas admin
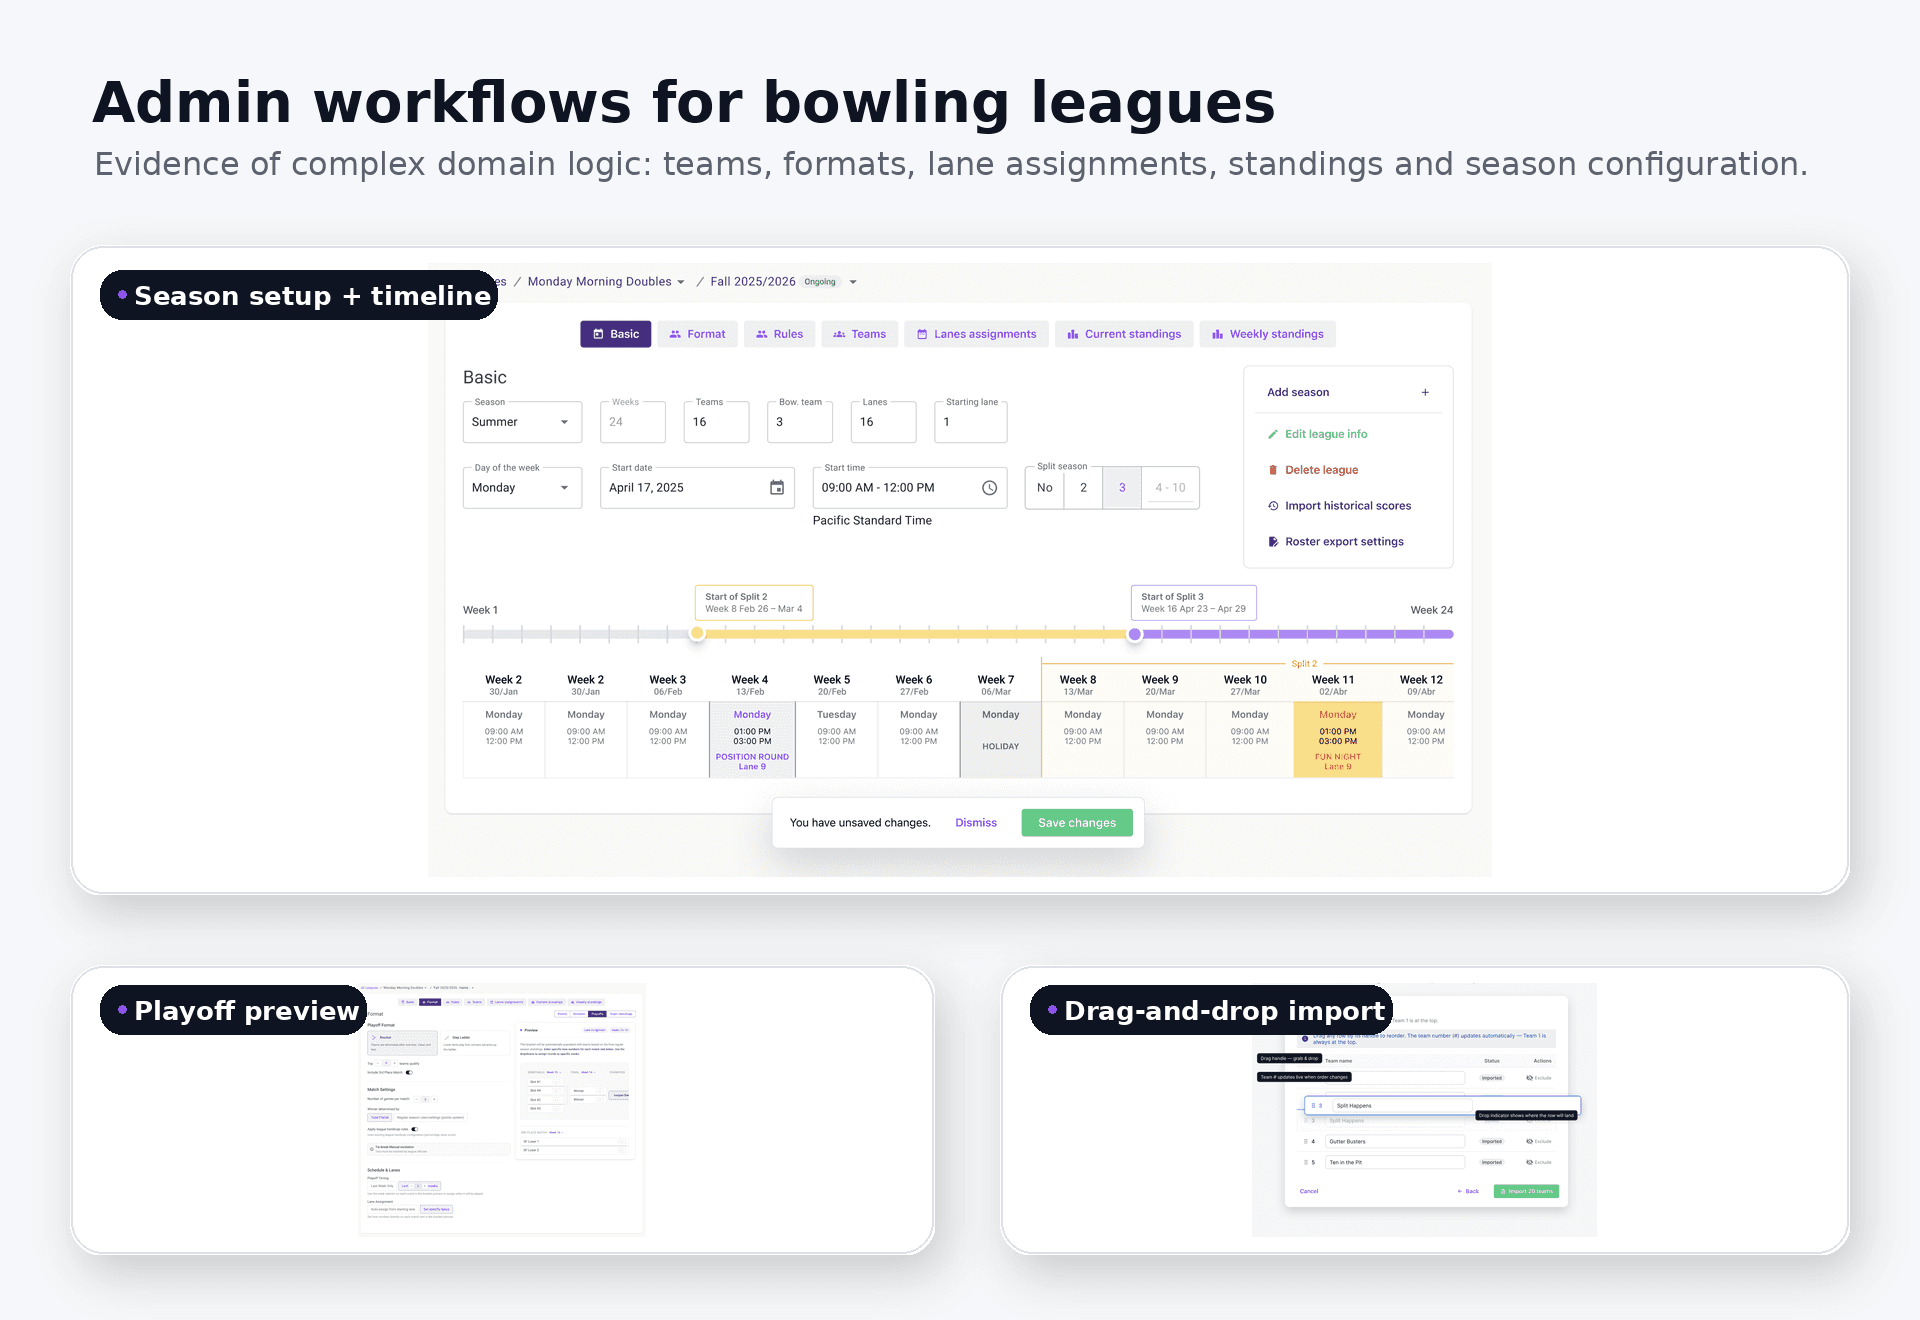
El software de bowling carga mucha complejidad de dominio: frames, pin state, scorecards, equipos, lanes, temporadas, playoffs, standings, torneos, ticketing y operaciones de centros.
LaneTalk necesitaba que esa información se mantuviera legible en contextos muy distintos. Los bowlers necesitan feedback móvil rápido. El staff de centros necesita controles admin fiables. Los espectadores de live scoring necesitan información en vivo clara. Los flujos de ticketing necesitan estados transaccionales claros.
Usuarios / contexto
Bowlers, staff de centros, organizadores, espectadores live y compradores de tickets
LaneTalk sirve a bowlers casuales, jugadores competitivos, participantes de ligas, centros de bowling, seguidores de torneos, admins, operadores, compradores de tickets y usuarios Android/iOS que interactúan con flujos conectados a la app.
El contexto de producto incluye centros conectados, scorecards móviles, selección y claim de juegos, setup de ligas, imports de equipos, asignación de lanes, formatos de playoff, live scoring público, standings, ticketing, checkout, estadísticas y flujos de comparación.
- Los bowlers hacen tracking de juegos, progreso, scores frame-level, filtros y juegos claimed.
- El staff de centros gestiona ligas, equipos, lanes, temporadas, imports y estructura de calendario.
- Los organizadores configuran formatos de torneo, playoffs, standings y contextos de ticketing.
- Los espectadores públicos y de live scoring necesitan información legible sin detalle admin.
Restricciones
Datos en tiempo real, lógica de dominio, densidad responsive y fiabilidad
Los cambios de score necesitaban aparecer rápido y seguir siendo entendibles mientras los juegos se actualizaban. Conceptos específicos de bowling como frames, pin state, rankings, promedios, equipos, lanes, temporadas, playoffs y lógica de liga requerían decisiones UI de dominio.
Las interfaces tenían que mantenerse coherentes entre web, admin, mobile-adjacent, live scoring y ticketing, mientras soportaban formularios admin con mucho estado, unsaved changes, imports, reordering, previews, layouts densos, componentes compartidos y fiabilidad de producción.
Decisiones de diseño
Separar cada superficie manteniendo coherente el sistema de producto
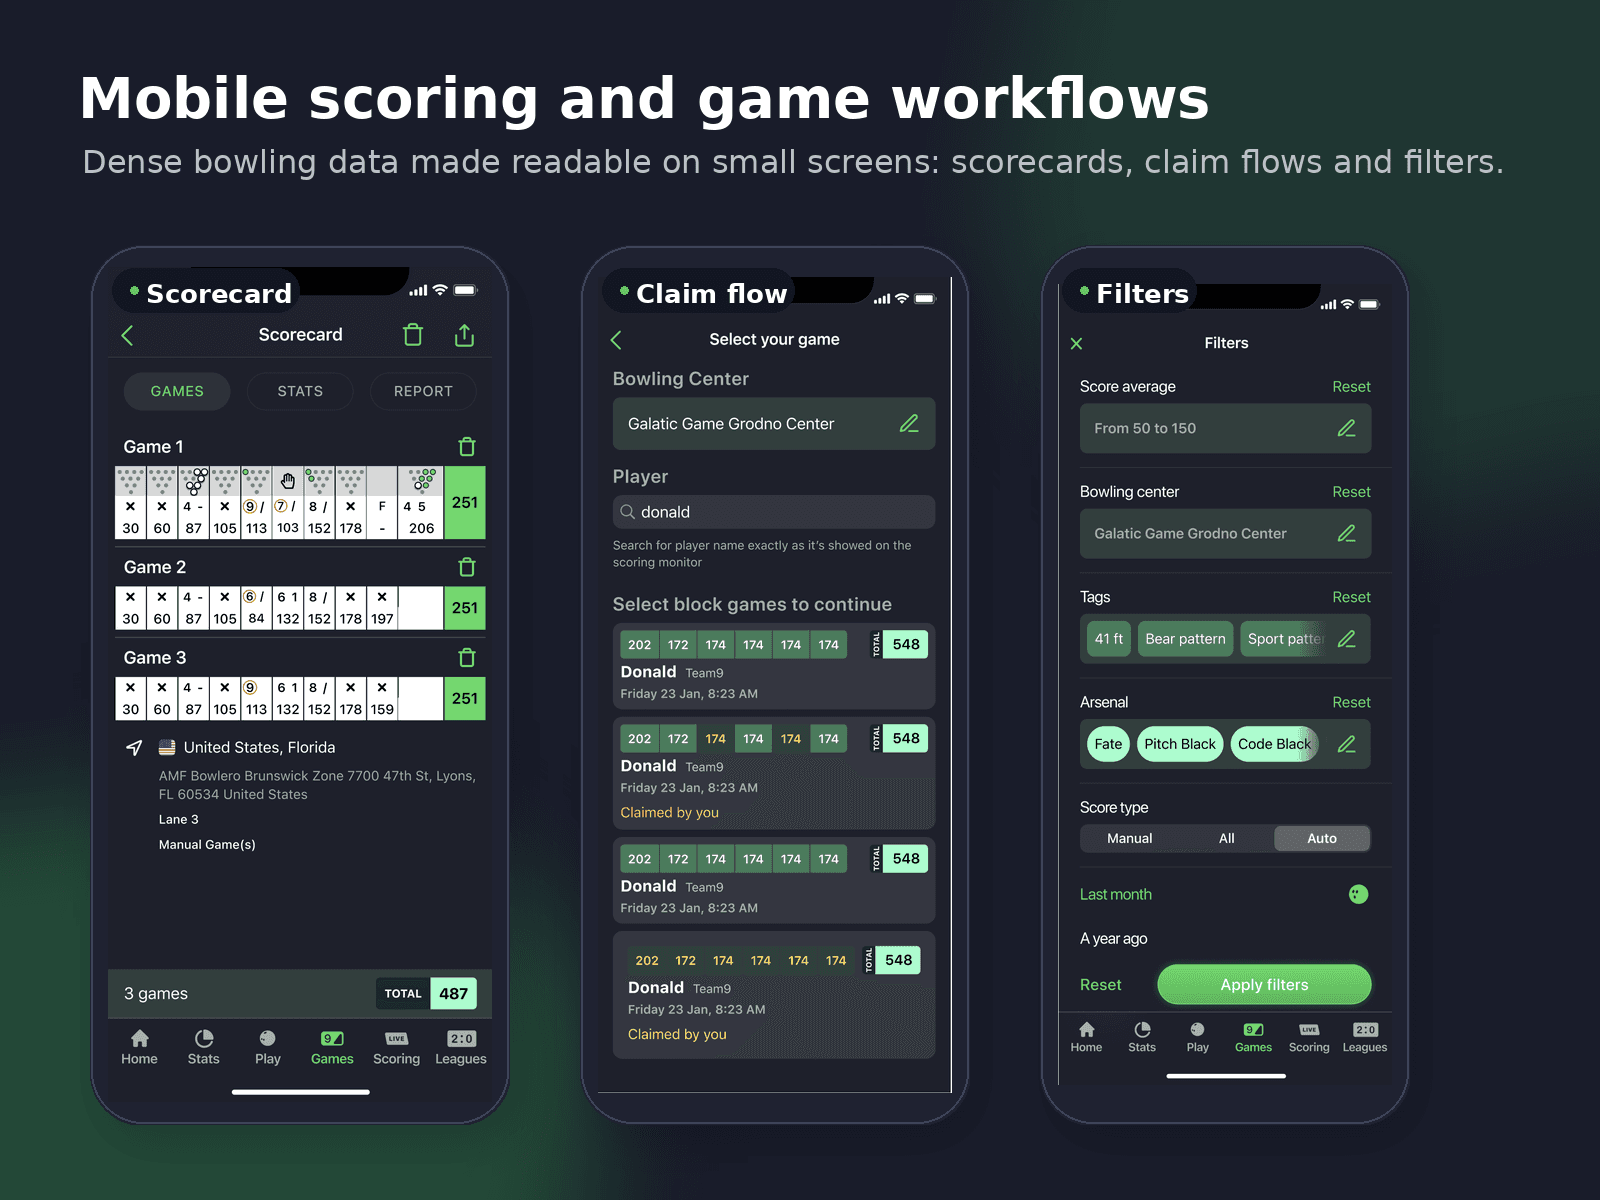
Los datos de score necesitaban jerarquía fuerte, color, agrupación y patrones repetidos para que el detalle frame-by-frame siguiera siendo escaneable. Las vistas admin necesitaban estado visible, acciones, previews y feedback para elecciones como brackets de playoff, asignación de lanes, imports y unsaved changes.
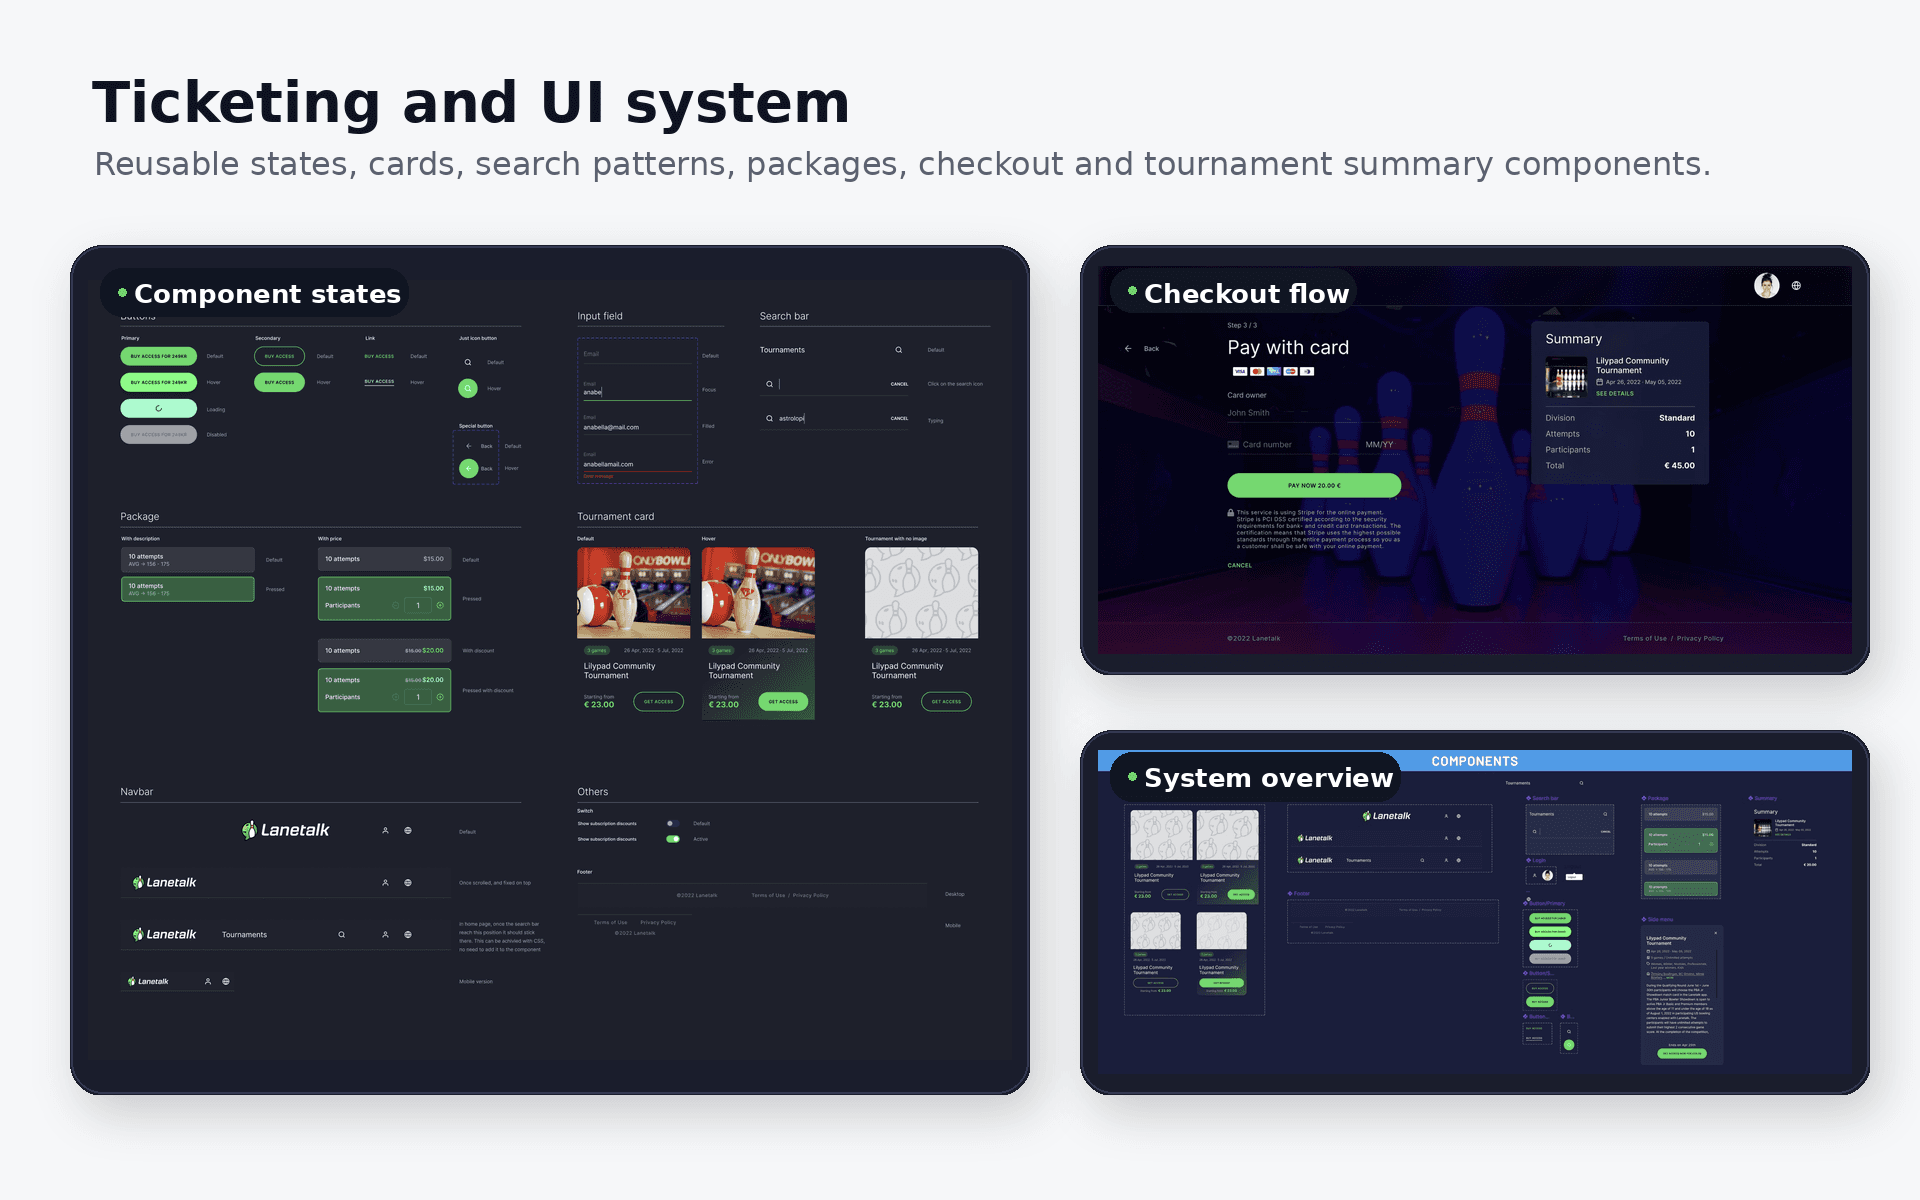
Las pantallas móviles se mantuvieron compactas y de alto contraste para el contexto de bowling y la lectura de scores. Las vistas públicas enfatizaban claridad y estado. Las pantallas de ticketing enfatizaban selección, confianza de checkout y estados de componentes claros.
- Usar preview panels para decisiones admin complejas como brackets de playoff y asignación de lanes.
- Hacer visibles drag/drop, imported states, claimed games, unsaved changes, reset/apply actions y loading states.
- Diseñar desde workflows desktop densos y tablas hacia estados móviles compactos sin hacer que LaneTalk parezca solo una app móvil.
Interacción / sistema UI
Patrones compartidos para scoring, admin, ticketing y estados
Los patrones compartidos aparecen en tableros de scoring en vivo, filas de score por jugador, frame grids, selectores de centro, tablas de ranking, vistas de torneo, dashboards admin, flujos de ticketing, pantallas de checkout y estados vacíos.
El trabajo de componentes cubrió botones, inputs, búsqueda, package cards, tournament cards, side menus, score chips, filter sheets, bottom navigation, híbridos table/card y estados visibles para loading, disabled, hover, focus, active, completed, error, claimed y empty.
Implementación y colaboración
Arquitectura frontend para interfaces de producto en vivo
Trabajé como Designer & Lead Frontend Developer junto a PM, backend developers y mobile app developers, diseñando e implementando interfaces de producción mientras colaboraba en comportamiento de producto y delivery.
Mi contribución incluyó interfaces públicas e internas de LaneTalk, una librería de resultados en vivo basada en WebSockets para LiveScoring, interfaces frontend con TypeScript, UI responsive, optimización de performance, mejoras de handoff, un design system cross-surface y soporte a la migración de Angular a React cuando aplicaba.
Resultado
Interfaces más rápidas, operaciones más claras y entrega más consistente
Los resultados confirmados incluyen mejora en display y responsiveness de datos en tiempo real para interfaces de scoring en vivo, reducción promedio de load time de 35%, Lighthouse scores por encima de 88, entrega de producto 38% más rápida, carga de app legacy 40% más rápida después de la migración de Angular a React y 1K+ usuarios activos en los tres meses posteriores a la migración cuando aplicaba.
El resultado fue un conjunto más claro de flujos de bowling en admin, mobile-adjacent, live scoring público y ticketing.
Stack