
Case study
LaneTalk
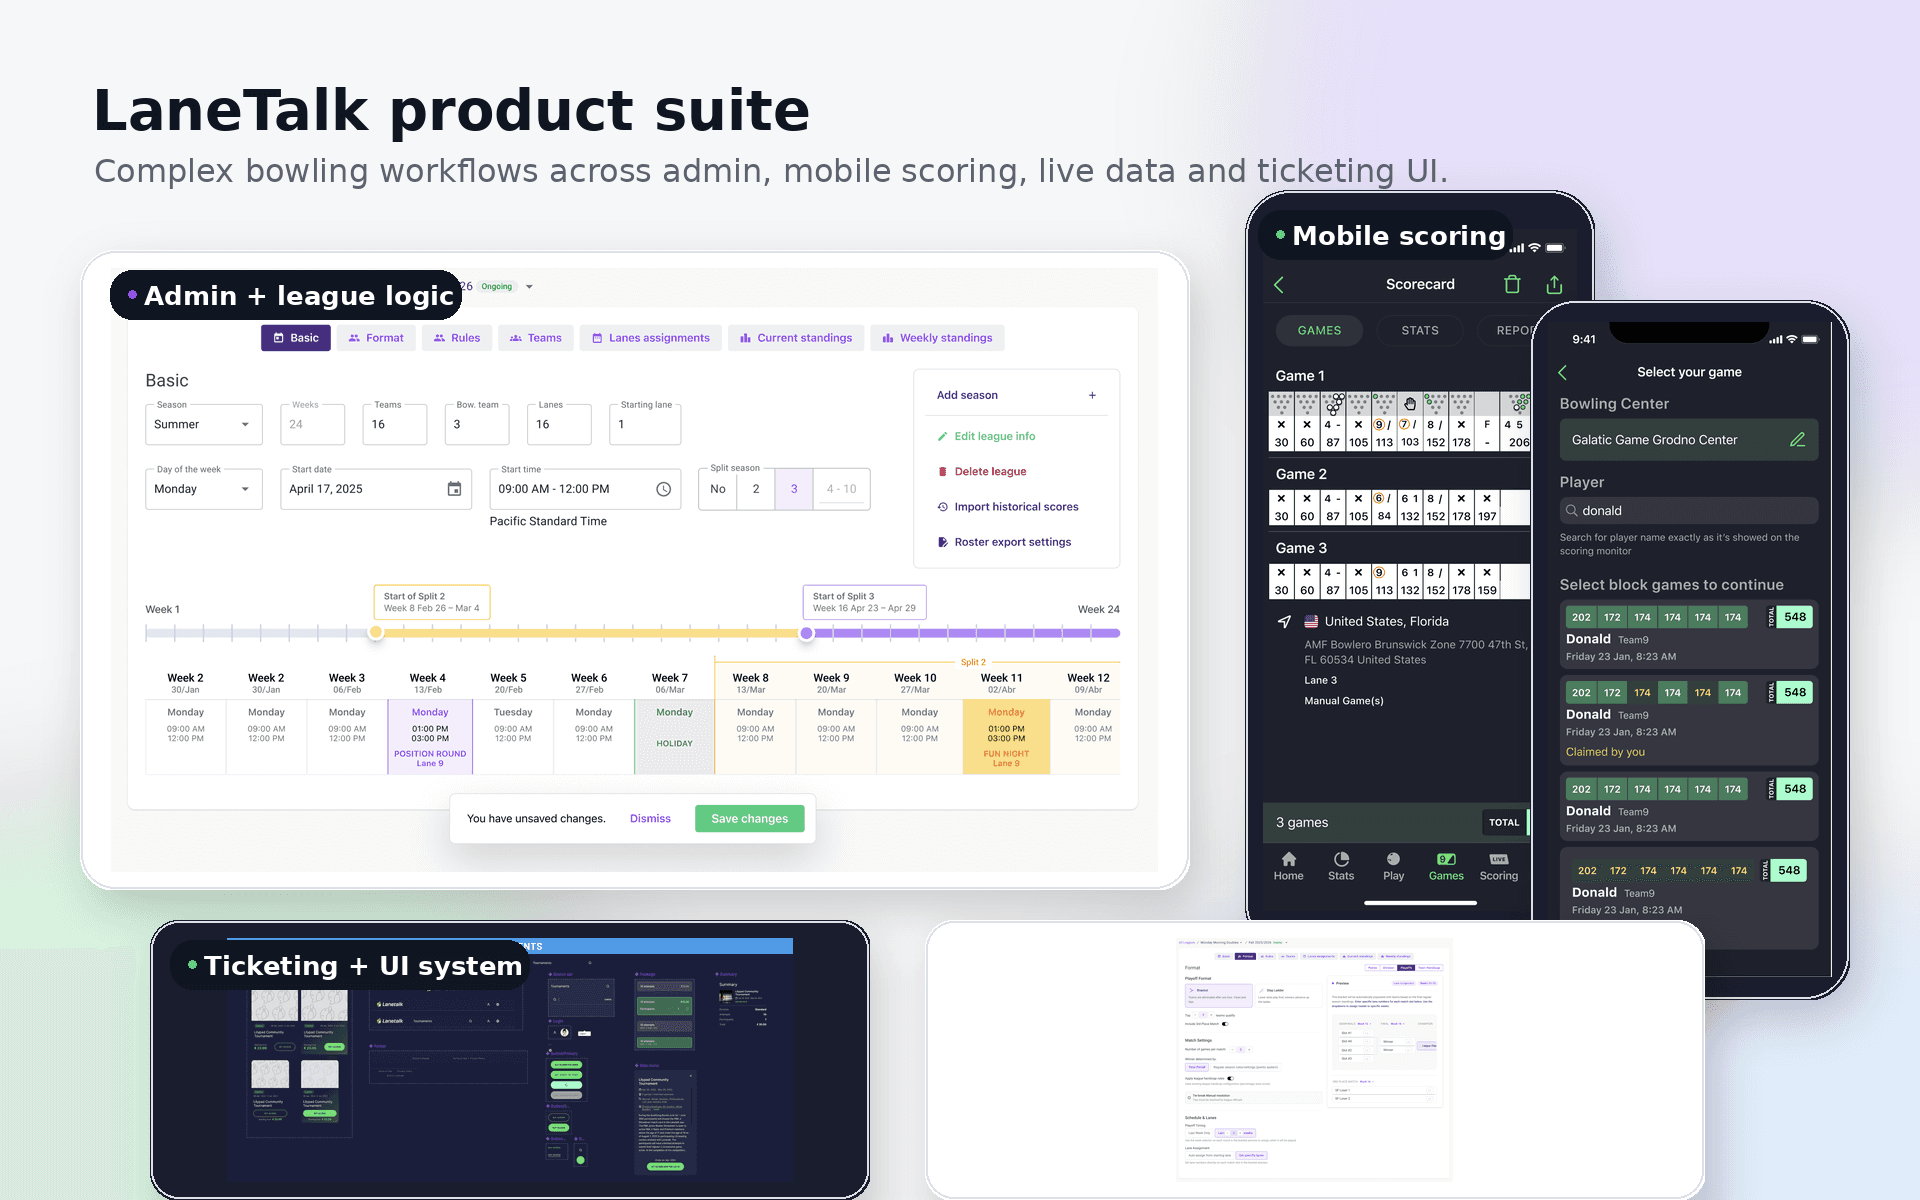
Product UI for live scoring, admin, ticketing, mobile-adjacent workflows, and shared interface systems.
LaneTalk is a bowling product for scoring, leagues, tournaments, ticketing, and center operations. I designed and built frontend interfaces for live scoring, admin tools, mobile-adjacent flows, and a design system used across admin sites, websites, and iOS and Android app workflows. The work made fast-changing bowling data easier to read, operate, and extend.
- Role
- Designer & Lead Frontend Developer
- Period
- Recent work, concentrated over the last 3 years
- Ownership
- Designed and implemented product interfaces across live scoring websites, admin tools, ticketing, mobile-adjacent workflows, UI systems, component standards, and production frontend delivery.
35%
average load-time reduction
38%
faster product delivery
40%
faster legacy-app load times after Angular-to-React migration
88+
Lighthouse scores achieved consistently
1K+
active users within three months after migration


Problem
Make bowling data easier to use across apps, live scoring, and admin tools
Bowling software carries a lot of domain complexity: frames, pin state, scorecards, teams, lanes, seasons, playoffs, standings, tournaments, ticketing, and center operations.
LaneTalk needed that information to stay readable across very different contexts. Bowlers need fast mobile feedback. Center staff need reliable admin controls. Public live-scoring viewers need readable live information. Ticketing flows need clear transactional states.
Users / context
Bowlers, center staff, organizers, live viewers, and ticket buyers
LaneTalk serves casual bowlers, competitive players, league participants, bowling centers, tournament followers, admins, operators, ticket buyers, and Android/iOS users interacting with app-adjacent flows.
The product context spans connected centers, live scoring websites, mobile scorecards, game selection and claiming, league setup, team imports, lane assignment, playoff formats, standings, ticketing, checkout, stats, and comparison workflows.
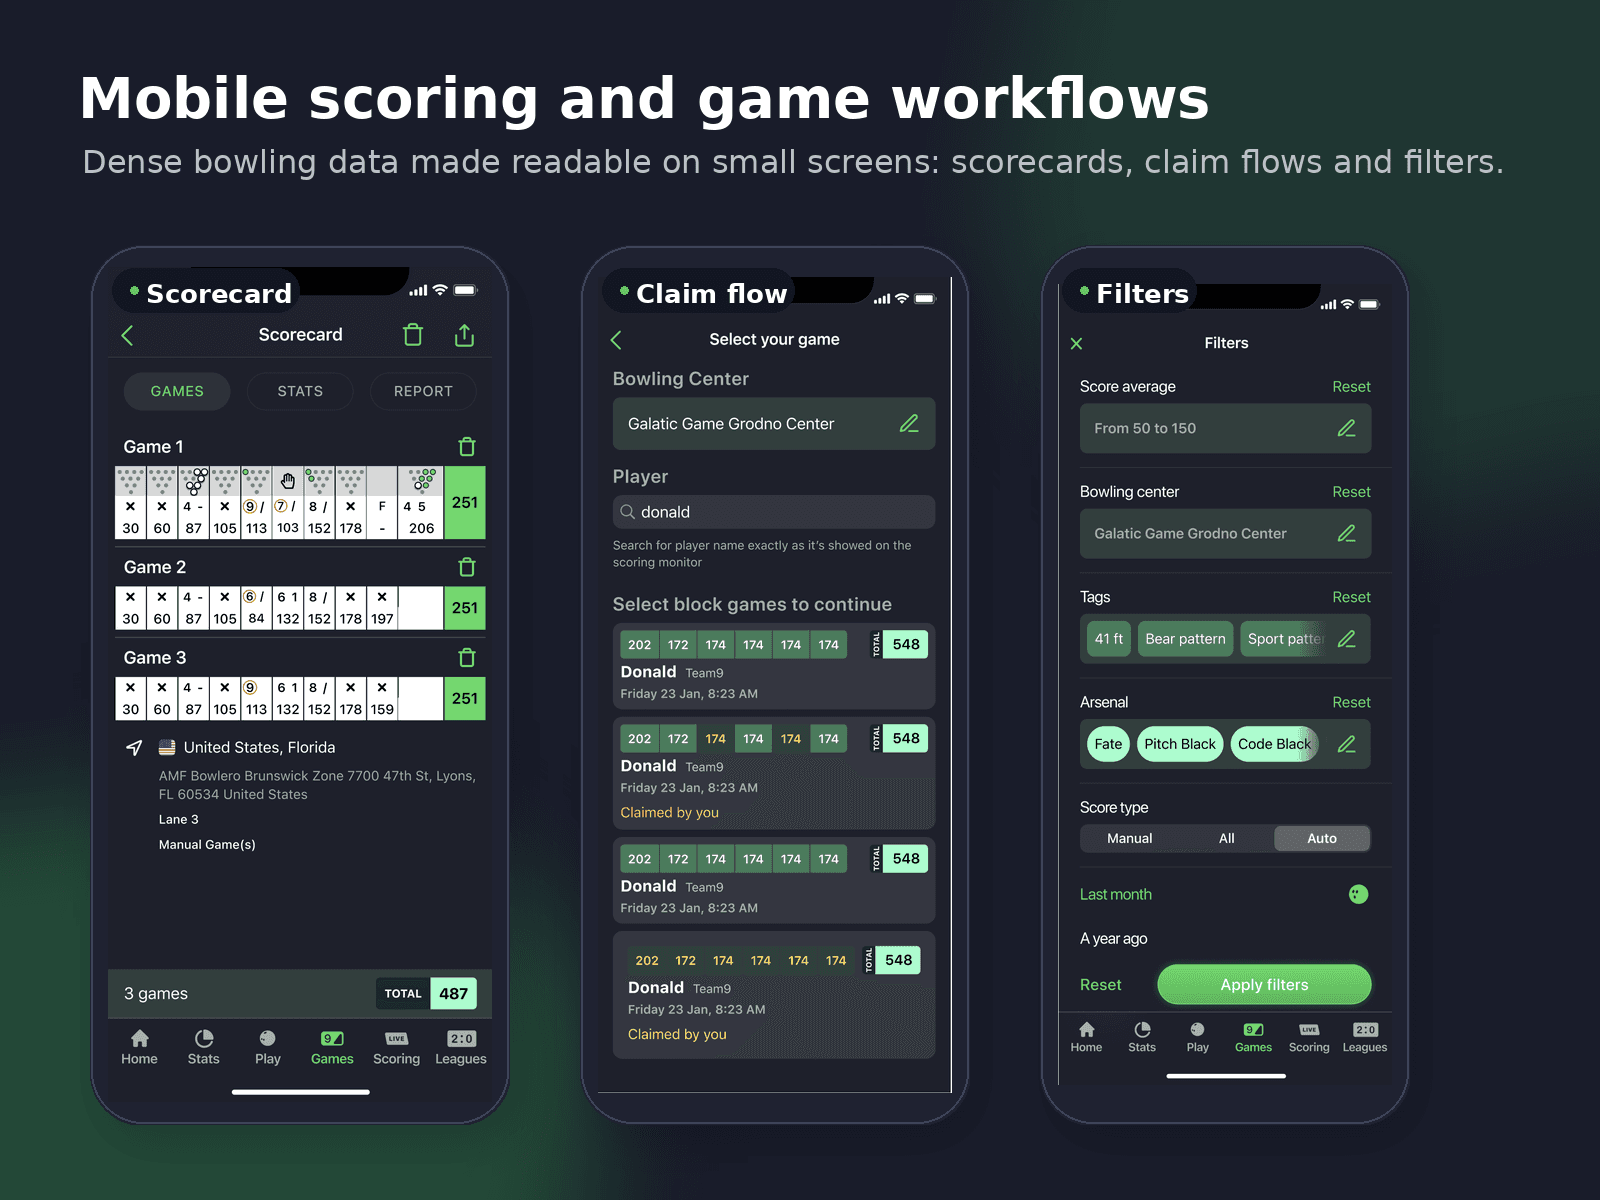
- Bowlers track games, progress, frame-level scores, filters, and claimed games.
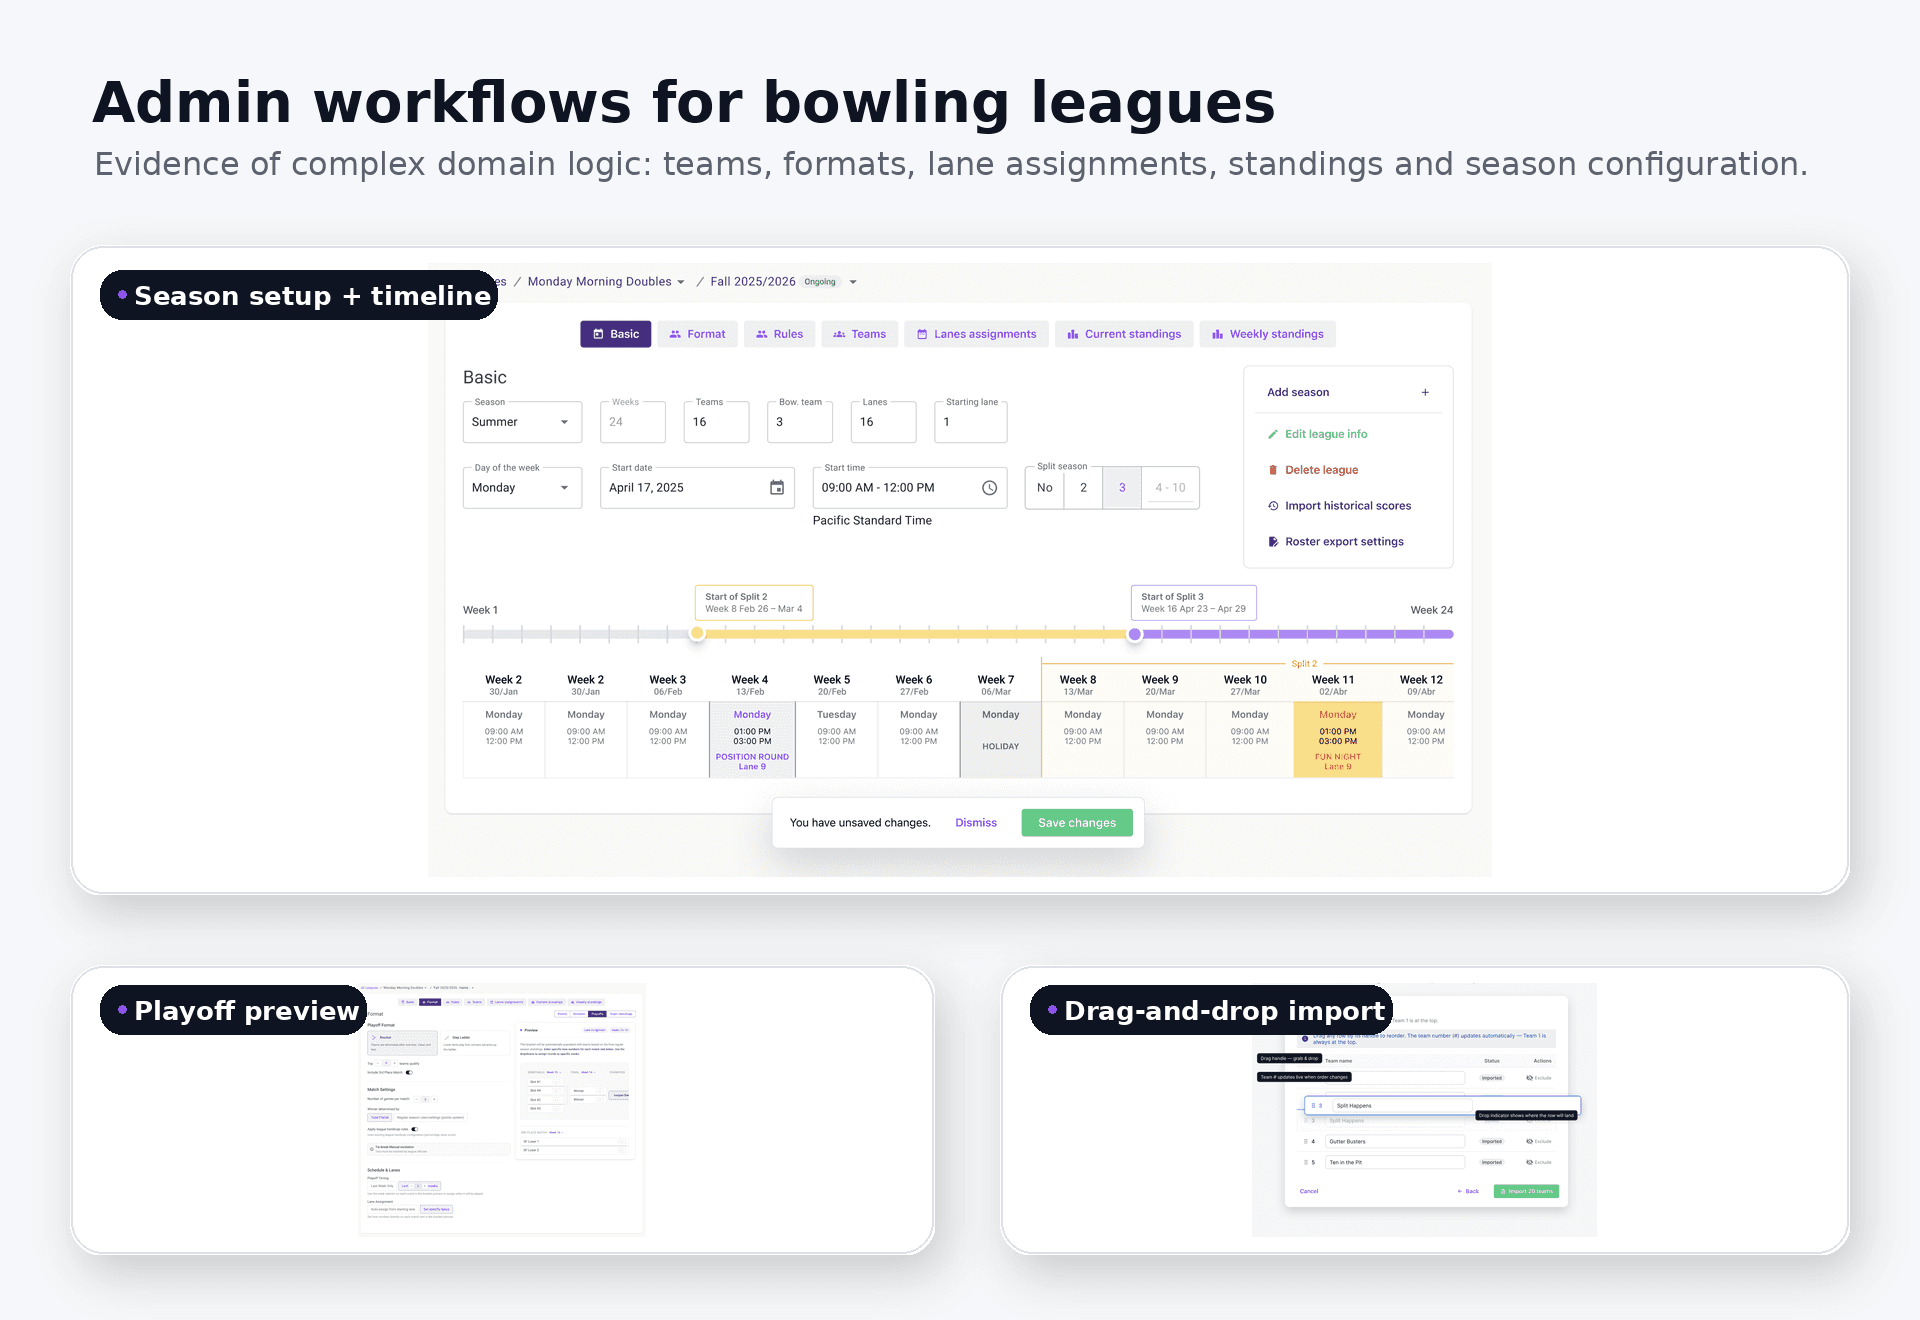
- Center staff manage leagues, teams, lanes, seasons, imports, and schedule structure.
- Organizers configure tournament formats, playoffs, standings, and ticketing contexts.
- Public and live-scoring viewers need readable information without admin-level detail.
Constraints
Real-time data, domain logic, responsive density, and reliability
Score changes needed to appear quickly and remain understandable as games updated. Bowling-specific concepts such as frames, pin state, rankings, averages, teams, lanes, seasons, playoffs, and league logic required domain-specific UI decisions.
The interfaces had to stay coherent across live scoring websites, admin, mobile-adjacent, and ticketing surfaces while supporting state-heavy admin forms, unsaved changes, imports, reordering, previews, dense layouts, shared components, and production reliability.
Design decisions
Separate each surface while keeping the product system coherent
Score data needed strong hierarchy, color, grouping, and repeated patterns so frame-level details stayed scannable. Admin views needed visible status, actions, previews, and feedback for choices such as playoff brackets, lane assignments, imports, and unsaved changes.
Mobile screens stayed compact and high-contrast for bowling context and score readability. Live scoring website views emphasized clarity and status. Ticketing screens emphasized selection, checkout confidence, and clear component states.
- Use preview panels for complex admin choices such as playoff brackets and lane assignments.
- Make drag/drop, imported states, claimed games, unsaved changes, reset/apply actions, and loading states visible.
- Design from dense desktop and table workflows down to compact mobile states without making LaneTalk feel like only a mobile app.
- Handle no games, offline centers, empty leaderboards, loading, partial data, and long player or team names.
Interaction / UI system
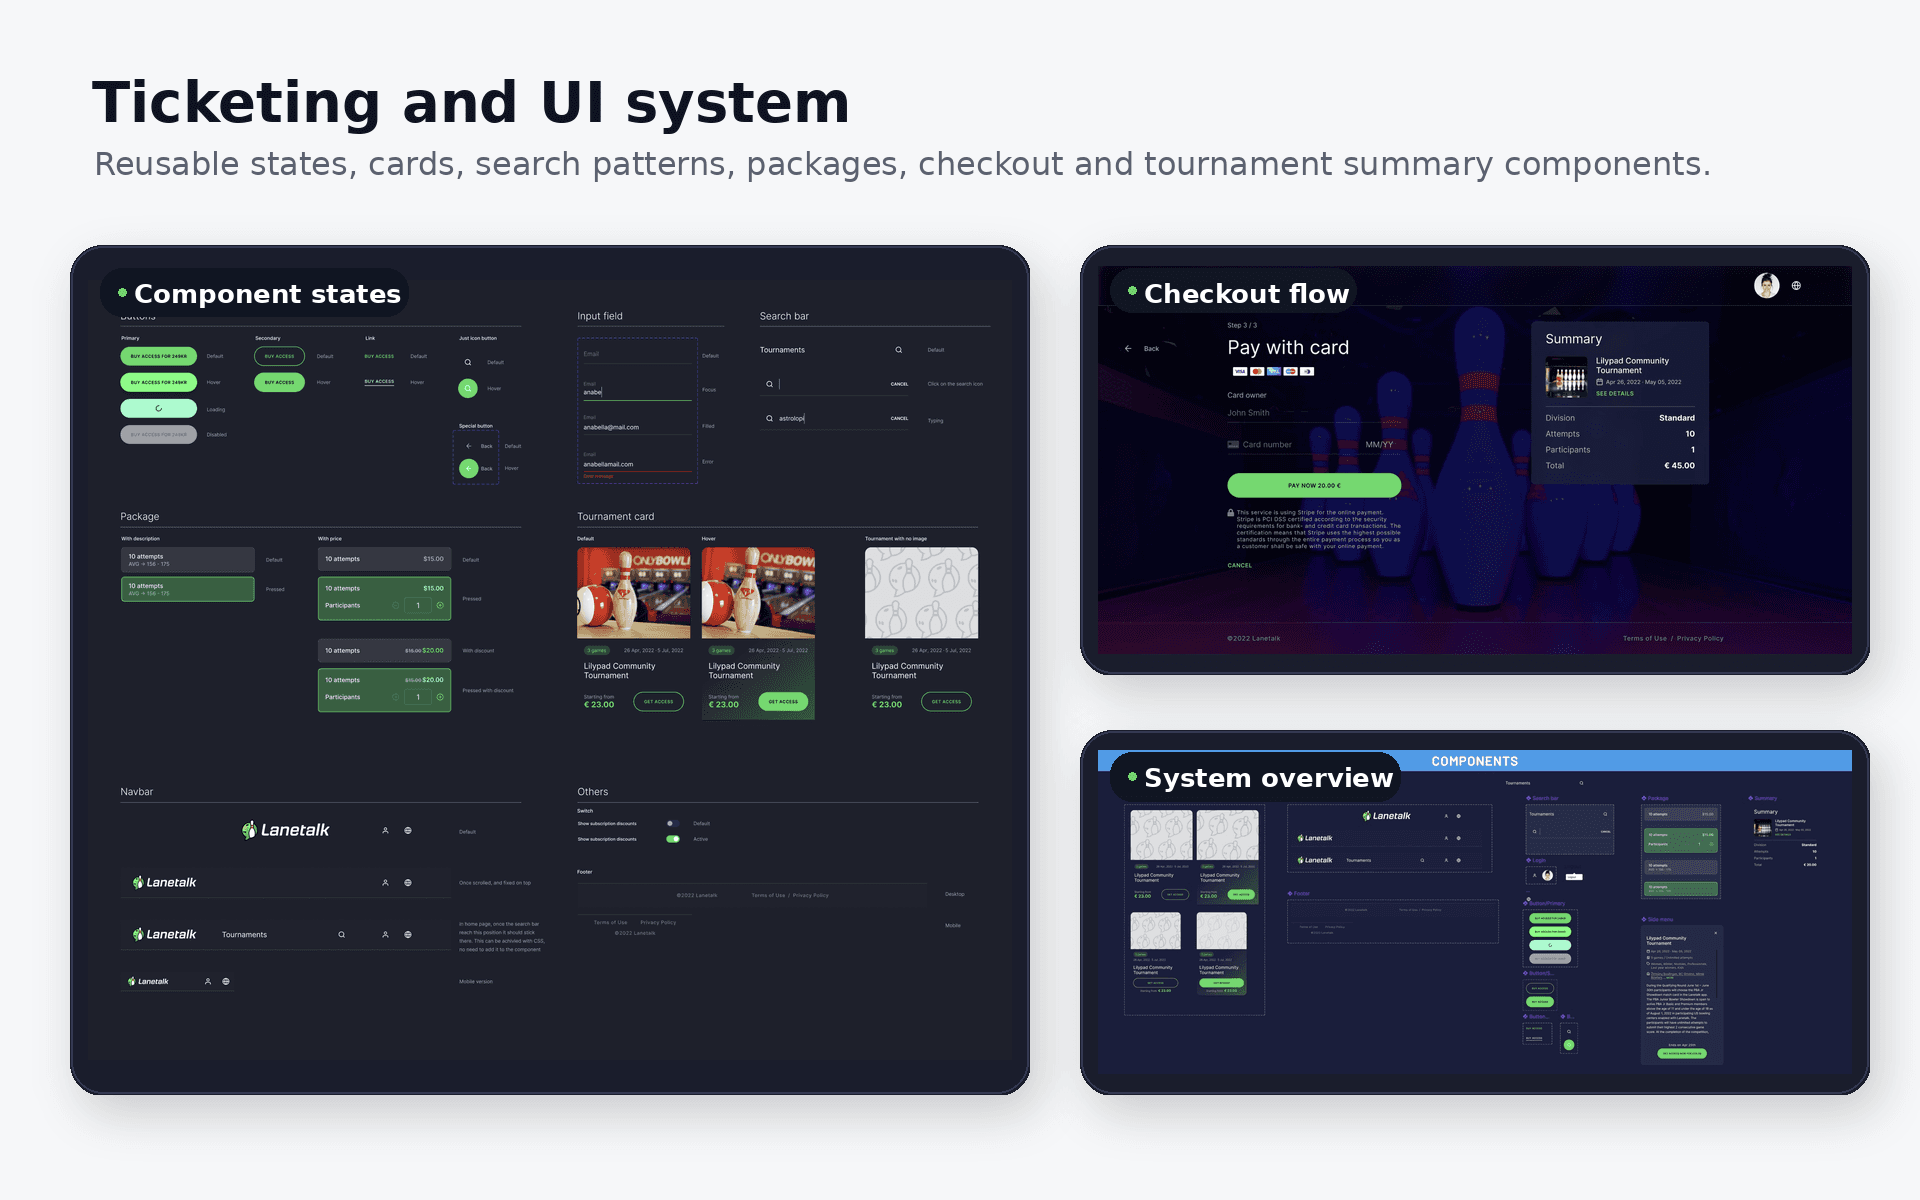
Shared score, admin, ticketing, and state patterns
The shared patterns show up in live scoring boards, player score rows, frame grids, center selectors, leaderboard tables, tournament views, admin dashboards, ticketing flows, checkout screens, and empty states.
The component work covered buttons, inputs, search, package cards, tournament cards, side menus, score chips, filter sheets, bottom navigation, table/card hybrids, and visible states for loading, disabled, hover, focus, active, completed, error, claimed, and empty.
Implementation collaboration
Frontend architecture for live product surfaces
I worked as Designer & Lead Frontend Developer with a PM, backend developers, and mobile app developers, designing and implementing production interfaces while collaborating on product behavior and delivery.
My contribution included public and internal LaneTalk interfaces, a WebSocket-based live-results library for live scoring websites, frontend interfaces with TypeScript, responsive UI, performance optimization, design handoff improvements, a cross-surface design system, and Angular-to-React migration support where applicable.
Outcome
Faster interfaces, clearer operations, and more consistent delivery
Confirmed outcomes include improved real-time data display and responsiveness for live scoring websites, 35% average load-time reduction, Lighthouse scores above 88, 38% faster product delivery, 40% faster legacy-app loading after Angular-to-React migration, and 1K+ active users within three months after migration where applicable.
The result was a clearer set of bowling workflows across admin, mobile-adjacent, public live scoring, and ticketing interfaces.
Stack